

This post contains up-to-date 2026 International Travel Statistics data. All information is referenced to its source.
Contents
- 1 International Travel Statistics: USA Departures & Arrivals
- 2 Most Visited Countries by International Tourist Arrivals
- 3 International Air Transportation Association (IATA)
- 4 International Tourism Receipts
- 5 Importance of Newspaper and Magazine Travel Articles
- 6 Impacts of Over Tourism
- 7 Cost of Travel
- 8 Use of Smartphones for Check-in
- 9 Lodging Travel Statistics
- 10 Public Transit Statistics
- 11 Cruise Travel Statistics
- 12 Most Traveled Cities of the World
- 13 Sustainable Travel Statistics
- 14 Conclusion
International Travel Statistics: USA Departures & Arrivals
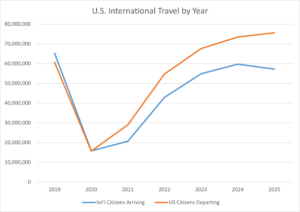
The number of U.S. Citizens departing the United States and of International Visitors to the United States has increased significantly since the low levels recorded during the COVID-19 pandemic. In 2025, 75 million U.S. citizens traveled internationally, compared with 60 million in 2019. However, there is a developing problem.
International Citizens Arriving in the United States is Declining
International Travelers arriving in the United States, which had been growing at a pace to surpass 2019 levels, took a downward turn in 2025. As shown in the chart below, a new trend is emerging and affecting future growth. Despite four years of growth (2021-2024), international visitors to the United States declined in 2025 (57.2 million versus 59.7 million in 2024) and have yet to reach the 65 million that visited in 2019. Unclear whether this is a one-year negative trend aberration or a new directional trend. We’ll update the data next year to verify. In any case, the number of international travelers to the United States is disappointing.
The data source is monthly data from the U.S. Government International Trade Administration, published in February 2026. The author produced the chart after summarizing annual data.
| Int’l Citizens Arriving | US Citizens Departing | |
| 2019 | 65,172,205 | 60,629,546 |
| 2020 | 15,825,968 | 15,694,689 |
| 2021 | 20,631,784 | 28,991,236 |
| 2022 | 42,918,323 | 54,679,835 |
| 2023 | 54,845,758 | 67,596,830 |
| 2024 | 59,727,209 | 73,426,281 |
| 2025 | 57,197,935 | 75,591,772 |

travel map
Which U.S. Cities Are Most Impacted By The 2025 Decline in International Travel Visitors?
The International Travel Visitor decline in the United States in 2025 isn’t having a uniform impact across the United States. It particularly is impacting cities that traditionally rely on:
- Canadian cross-border visitors, down ~22% (Seattle, Portland, Minneapolis, Nashville, Las Vegas)
- Long-haul travelers from Europe and Asia (New York, Los Angeles)
- Family and leisure tourism markets (Orlando, Miami)
- Tourist arrivals from Mexico: (New York, Chicago, Atlanta, Houston, San Antonio, and Dallas)
Here are the impacts by city:
- Las Vegas, NV:~10% decline, mostly from Canadian Markets
- Seattle, WA: One of the steepest declines in international arrivals, ~27%
- Portland, OR: Similar to Seattle, ~18%
- Nashville, TN & Minneapolis, MN: Both cities with declines over 14%
- New York City, NY: 12% decline in visitors from Mexico
- Miami & Orlando, FL: Drops in family travel (~3-5%)
- Chicago, IL, Dallas-Fort Worth, TX, & Los Angeles, CA: Roughly 2-3% decline
- Washington, DC: ~1-6.5% depending on source and measurement period
Most Visited Countries by International Tourist Arrivals
Accordingly to data from the United Nations World Tourism Organization (UNWTO), somewhat surprisingly, the United States only ranked third in the total number of international visitors in 2024. In 2024, there were 1.45 billion international tourists, with a growth of 11.5% compared to 2023. The top ten destinations were:
| Destination | 2024[1] | Change (2023 to 2024) (%) | 2023[2] | 2022[3] |
|---|---|---|---|---|
| France | 102.0 | 100 | 79.4 | |
| Germany | 37.5 | 34.8 | 28.5 | |
| Greece | 36.0 | 32.7 | 27.8 | |
| Italy | 57.8 | 57.2 | 49.8 | |
| Japan | 36.9 | 25.1 | 3.8 | |
| Mexico | 45.0 | 42.2 | 38.3 | |
| Spain | 93.8 | 85.2 | 71.7 | |
| Turkey | 60.6 | 55.2 | 50.5 | |
| United Kingdom | 41.8 | 37.2 | 30.7 | |
| United States | 72.4 | 66.5 | 50.9 |
We will update this information once the United Nations publishes the 2025 data. It will be interesting to see if the 2025 decline in International Travel to the United States, shown in the first chart, is particular to only the United States.
Additionally, when analyzing the travel recovery by year and by region, the UNWTO shows that the Middle East is improving much quicker than anywhere else in the world; Asia Pacific, which declined to 93% of its pre-pandemic travel in 2021, is still lagging the most in its recovery.
International Air Transportation Association (IATA)
The International Air Transportation Association (IATA) projected a similar message about growth, albeit with different data by region. Basically, IATA was more robust about 2023 being a recovery year for some regions. They predicted that all regions would recover fully in 2023 or 2024. They predicted North America and Latin America recover fully in 2023, with the other regions recovering fully in 2024. Essentially, their predictions were correct.
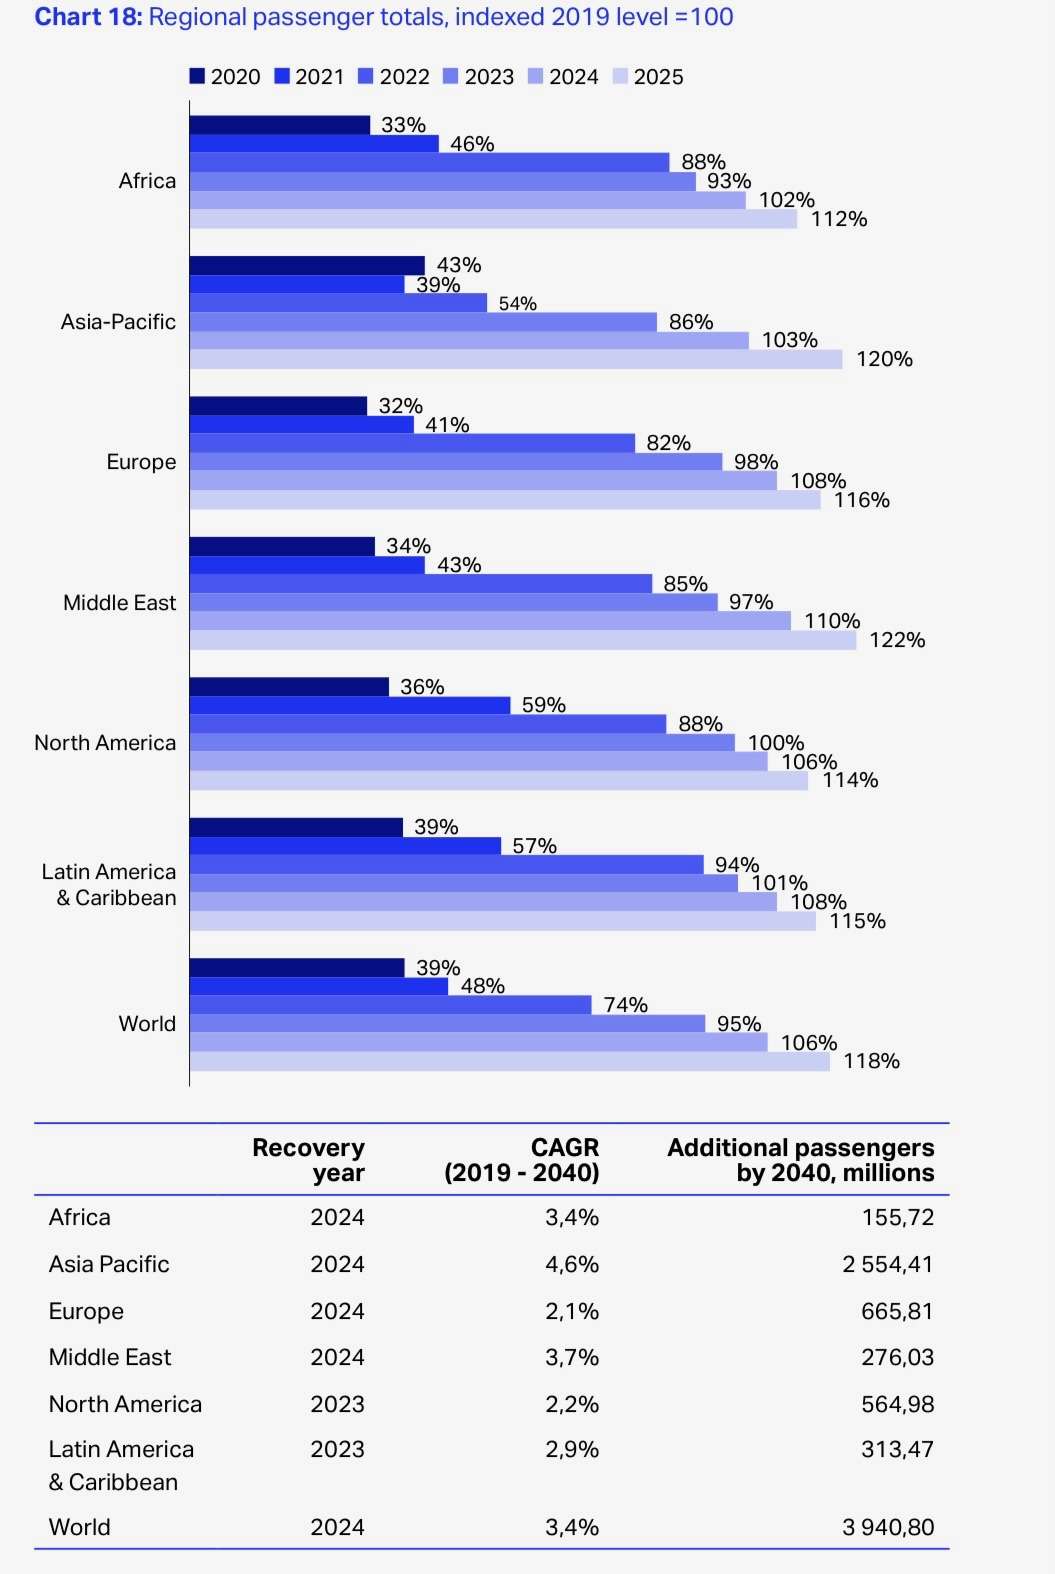
IATA is counting passengers, while UNWTO counts International Arrivals. It makes a difference, since domestic travel in places like the Americas is recovering much faster than International Arrivals in to the US, as Asian Traffic is clearly lagging.
Interestingly, Asian travel was expected to grow faster in 2024-25 and is expected to recover to 120% by 2025, second to the Middle East, which will recover to 122% by 2025. Asia Pacific is expected to add 2.5 million passengers a year by 2040, a startling number.
International Tourism Receipts
International tourism receipts, also tracked by UNWTO, are the earnings a country makes from foreign visitors’ spending on goods and services during their stay, such as expenditures accommodation, food and drink, and shopping. While International Travel into the United States declined in 2025, it is interesting to note that despite not having the most international travelers, more money is spent on travel in the United States than in any other country. In fact, in 2024 it was more than twice what was spent in Spain, the country with the second highest receipts. In 2024, the top ten destinations based on International Tourism Receipts were:
| Region | 2024 | 2023 | % Change (local currency) (2023 to 2024) |
|---|---|---|---|
| United States | 215.0 | 189.1 | |
| Spain | 106.5 | 92.0 | |
| United Kingdom | 84.5 | 73.4 | |
| France | 77.1 | 71.2 | |
| Italy | 58.7 | 55.9 | |
| United Arab Emirates | 57.0 | ||
| Turkey | 56.3 | 50.1 | |
| Japan | 54.7 | 38.6 | |
| Australia | 52.0 | 46.1 | |
| Canada | 49.9 | 45.4 |
According to IATA, the financial impact to the airline industry is as expected reflective of the falloff in global travel volumes. In addition, in 2023 there is continued falloff in cargo volumes compared to 2022, resulting from the slowing global economy.
Importance of Newspaper and Magazine Travel Articles
Do readers notice travel advertisements in newspapers and magazines, and does it impact their travel decisions? The % of respondents who agree that newspaper and magazine articles on holiday and travel influence their choice of holiday has declined. In 2026, only 51% of all people globally responding to a survey conducted by YouGov said that they were impacted. Here is a breakdown by some major countries:
- India (Highest Response rate) 71%
- USA 64%
- Australia 53%
- Canada 50%
- Germany 49%
- France 38%
- Japan 35%
- China (Lowest Response Rate) 34%
Impacts of Over Tourism
Over tourism occurs when the number of visitors exceeds a destination’s “carrying capacity,” leading to environmental degradation, rising housing costs for locals, and a diminished experience for travelers. In 2026, over tourism has shifted from a buzzword to a critical management crisis, with major cities like Barcelona, Venice, and Amsterdam implementing aggressive restrictions to protect local life. In another survey by YouGov, they found that in the United Kingdom 54% of all respondents are concerned about over tourism and 2/3rds of that group are considering altering their travel plans, likely traveling off-peak. In the United States, the concern is slightly less, with only 41% of respondents concerned.
The 2026 Over Tourism Landscape
While Barcelona, Venice, and Amsterdam remain on the radar, the focus has shifted to new areas of concern:
- Antarctica: Now topping “no-go” lists due to a tenfold increase in tourists over 30 years and the high carbon footprint of polar travel.
- The Canary Islands: Facing massive local protests over housing shortages and water strain.
- Montmartre, Paris: Reaching a saturation point with 11 million annual visitors, leading to resident friction.
- Mexico City: Grappling with severe gentrification and soaring rents driven by short-term rental platforms.
Travelers are increasingly adopting a “regenerative” mindset, focusing on how their presence affects a destination and altering their plans. For example:
- Exploring popular sites at night: (e.g., Kyoto’s geisha districts) to avoid daytime heat and crowds.
- Non-Viral Destinations: A surge in interest for “secondary cities” or lesser-known regions like Colombia’s Coffee Triangle, Northern Laos, or Inland Croatia.
- The Rail Revival: A 25% increase in rail bookings as travelers ditch short-haul flights for slower, more immersive overland journeys. this also has a sustainability benefit.
How to Travel Responsibly
To minimize your footprint and maximize local benefit, consider these strategies:
- Skip the “Top 10”: Look for “dupe” destinations. Instead of the Amalfi Coast, consider Sardinia or Croatia’s Dalmatian Coast.
- Stay in Hotels, Not Airbnbs: In many cities, short-term rentals have priced out locals. Opting for licensed hotels or locally-owned guesthouses helps keep housing available for residents.
- The “Slow Travel” Rule: Take one longer trip rather than three short ones. Spend more time in one area to truly support the local economy beyond just “ticking off” a landmark.
- Travel Off-Peak: 2026 is seeing the “shrinking off-season” in cities like Tokyo and London, but traveling during the “hidden seasons” (like spring in Morocco) still offers better value and less strain.
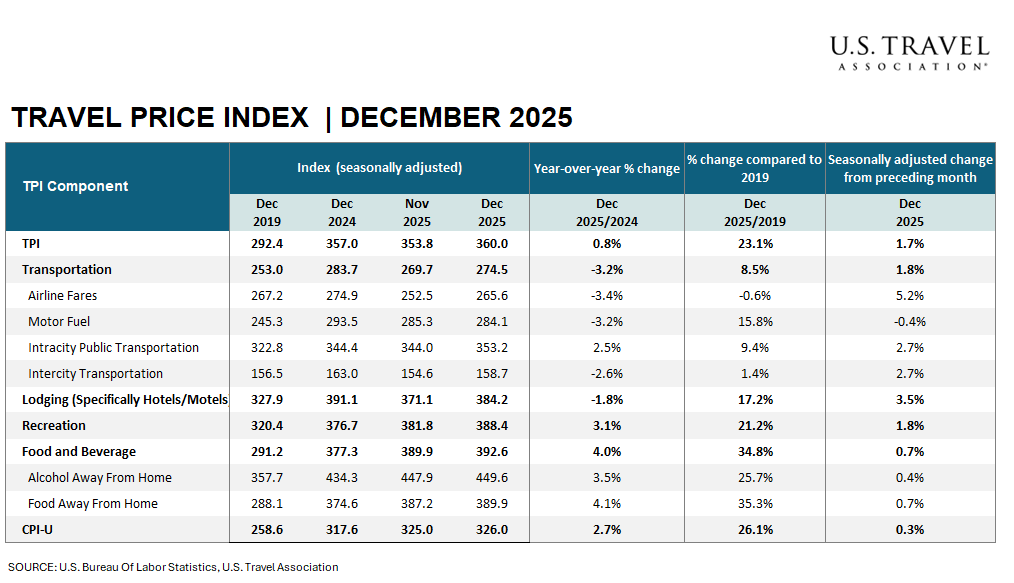
Cost of Travel
According to the U.S. Travel Association, a non-profit organization with a mission to increase travel to and within the United States, the overall cost of travel has increased by 23.1% since 2019. The data is based on information taken from the U.S. Government’s CPI data. Food and Beverage costs were the biggest increase in the overall cost of travel rising 34.8% over the same period. Motor fuel was the only cost component not increasing as it actually declined by 0.4% over the six-year period.
Use of Smartphones for Check-in
- High Adoption: The use of mobile apps and websites for check-in is now standard practice for the majority of U.S. passengers.
- Boarding Pass Usage: Almost two-thirds of travelers use mobile devices to board, a figure supported by Statista data indicating a 71% usage rate for boarding.
- Convenience Factor: Passengers overwhelmingly prioritize speed and convenience, driving the shift towards mobile apps for check-in, booking, and managing travel plans.
- Future Trends: As of 2025, over 35% of passengers prefer to use mobile devices to generate baggage tags, further reducing the need for traditional desk interaction.
According to IATA in 2019, only 51% of passengers used smart phones to check-in. Clearly, the use of smartphones to check-in is getting extremely popular.
Lodging Travel Statistics
In 2026 the top five revenue-generating channels for hotels in the US continue to be Booking.com, Expedia, hotel websites (Direct), Agoda and Airbnb.
Other key stats on the US hotel industry for 2026 include:
- In the United States, hotel market revenue was estimated at around $263 billion in 2024 and is forecast to reach nearly $396 billion by 2030.
- As of 2024, there were around 49,800 hotels and motels operating in the U.S.
- The average US occupancy rate is forecast to stabilize at 62%.
- The US hotel industry now supports approximately 2.1 million direct employees.
Lodging Reservation Statistics
Thrivemyway.com has sourced a number of lodging statistics that are particularly interesting. These are especially important to hotel operators looking to improve their occupancy statistics.
- 83% of US adults prefer to book trips online, while, 41% prefer online travel agencies. Consequently, use of physical travel agencies is down to 24.3%.
- Booking.com is the most used travel site with 443 monthly visits.
- 700 million people worldwide are expected to book online hotel rooms in 2023.
- 2/3 of all reservations are made directly on a hotel website.
- 1/3 of leisure travelers in the US stayed in private accommodations.
- In 2021 the percentage of travel bookings done on a mobile device increased to 41%.
- Not unexpected, mobile users prefer apps over websites.
For more information about lodging please see the following cosguide4travel posts:
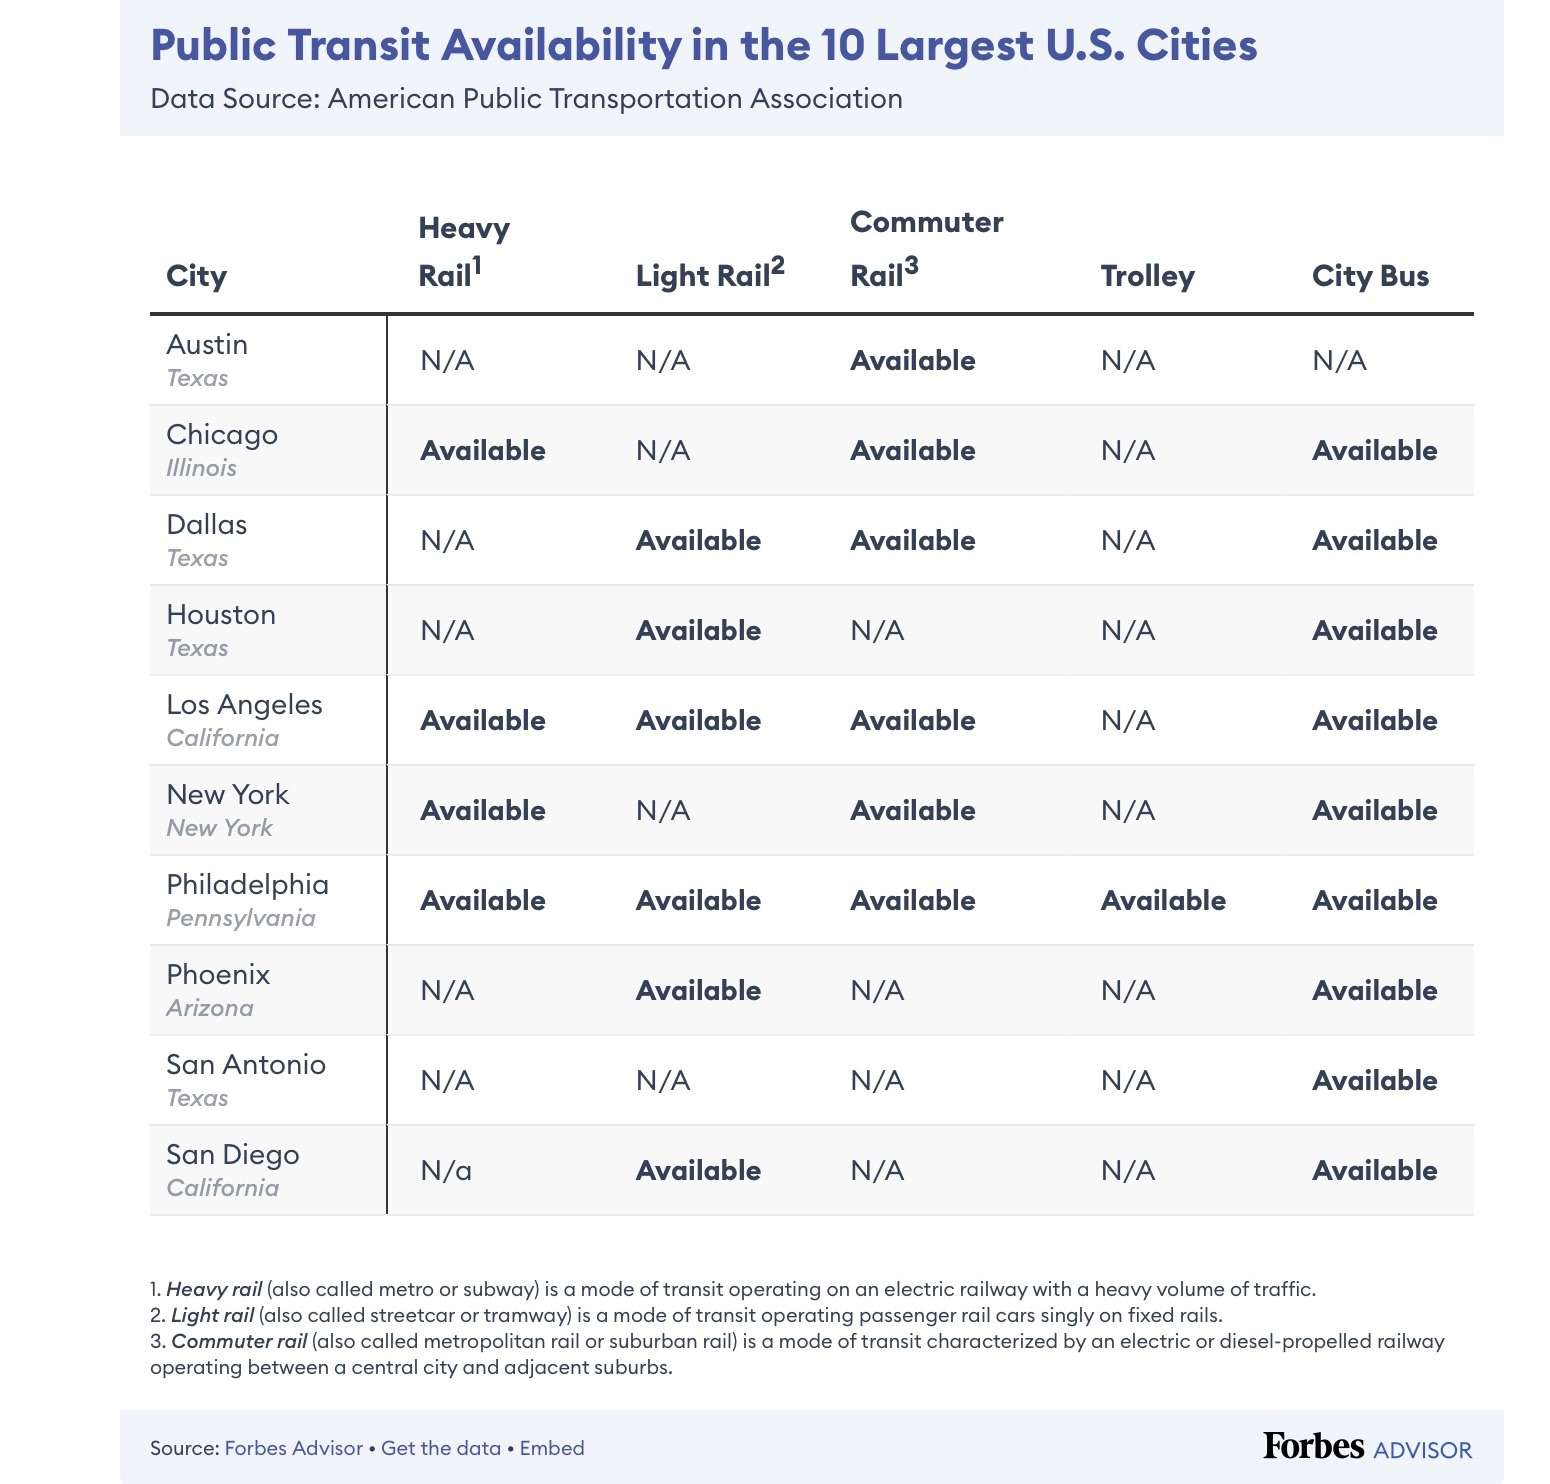
Public Transit Statistics
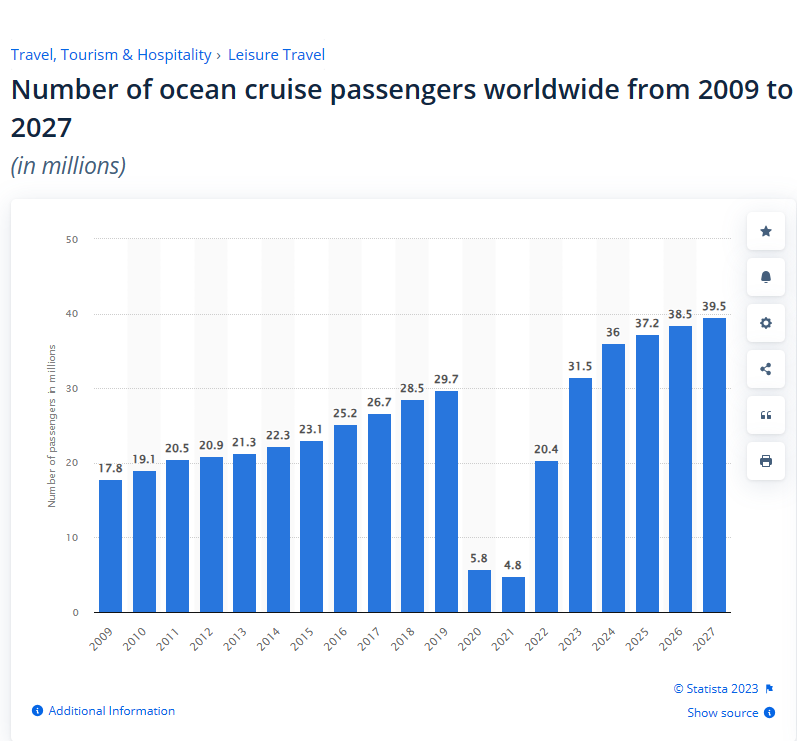
Cruise Travel Statistics
Key Cruise Industry Statistics (2024-2026)
- Passenger Volume: Global ocean cruise passengers reached nearly 35 million in 2024.
- Market Share: The U.S. constitutes over 50% of the global market.
- Growth Projection: Nearly 22 million U.S. travelers are expected to cruise in 2026, marking a 52% increase in six years.
- Economic Impact: Global cruise revenue exceeded $40 billion in 2024, with projections to surpass $50 billion by 2028.
- Duration: The average cruise lasts approximately 7.1 days.
Demographic & Traveler Behavior Trends
- Age: While historically older, the average age of a cruiser is now 46.5. However, 65% of U.S. passengers are 55 or older.
- Younger Generation: 69% of Gen Z and 59% of younger Millennials are interested in cruising.
- First-Timers: 31% of cruisers in the past two years were new to cruising.
- Booking Habits: 42% of cruisers plan their trips 12–18 months in advance.
- Repeat Business: 82% of past cruisers plan to sail again.
- Group Makeup: Roughly 50% travel as a couple, while 30% travel with children.
Popular Destinations & Logistics
- Top Destination: The Caribbean remains the top destination, chosen by nearly two-thirds of American travelers.
- Capacity: As of 2025, there are 425 ocean-going cruise vessels.
- New Ships: 15 new ships were added between 2024 and 2025, with a total capacity of 38,629 passengers.
- Expenditure: The average cost per person is $2,200, with an additional $565 spent on board or for shore excursions.
Without a doubt, the cruise industry was hurt more than any other industry during the pandemic. Essentially, it was virtually shut-down. However, it has come back strong.
For more information about Cruises please see the following cosguide4travel posts:
Most Traveled Cities of the World
There is clearly a movement easternly in terms of which cities in the world are most visited. For example, New York City, which was the 8th most visited city in the world in 2023, did not make the top ten list in either 2024 or 2025, while Bangkok which was 7th in 2023 is now #1 in 2025. Here is an analysis of this phenomena over the 3 year period, with data provided by Euromonitor.
| City | Country / | 2025 | 2024 | 2023 | |||||||
| Territory | Rank | Arrivals (Millions) | Growth | Rank | Arrivals (Millions) | Growth | Rank | Arrivals (Millions) | Growth | ||
| Bangkok |
| 1 | 30.3 | -7% | 1 | 32.4 | 37% | 7 | 12.2 | 142% | |
| Hong Kong |
| 2 | 23.2 | 6% | 4 | 20.5 | 19% | 6 | 14.7 | 2495% | |
| London |
| 3 | 22.7 | 4% | 3 | 21.7 | 7% | 2 | 18.8 | 17% | |
| Macau |
| 4 | 20.4 | 14% | 8 | 18.0 | 26% | ||||
| Istanbul |
| 5 | 19.7 | 6% | 2 | 23.0 | 14% | 1 | 20.2 | 26% | |
| Dubai |
| 6 | 19.5 | 7% | 7 | 18.2 | 8% | 3 | 16.8 | 18% | |
| Mecca |
| 7 | 18.7 | 7% | 5 | 19.3 | 20% | 10 | 10.8 | 124% | |
| Antayla |
| 8 | 18.6 | 8% | 6 | 19.3 | 17% | 4 | 16.5 | 29% | |
| Paris |
| 9 | 18.3 | 4% | 9 | 17.4 | 2% | 5 | 15.5 | 4% | |
| Kuala Lumpur |
| 10 | 17.3 | 5% | 10 | 16.5 | 73% | ||||
| New York City |
| 8 | 11.7 | 24% | |||||||
| Cancun |
| 9 | 10.8 | 13% |
New York City Travel Statistics
Making the city travel comparisons gets even more complicated when you consider domestic travel as well as international arrivals. For example, NYC & Company, the travel arm for NYC, reports that in 2025, New York City welcomed 64.7 million visitors, a 0.3% year-over-year increase but still slightly below the 2019 record of 66.6 million. The city remains the top US destination for overseas travelers, with over 9 million international visitors in 2023. Total visitors in 2024 reached 64.5 million, consisting of 12.9 million international and 51.6 million domestic tourists.
So, how do you compare these numbers to the numbers in the above table? Most of the other cities do not have anywhere near the number of domestic travelers that NYC has and, as such, if you based the comparisons on domestic numbers you would have a very different ranking. Tourism is very important to all these cities and especially to New York (where I worked for the City for four years 2007-2010).
According to NYC & Company, tourism supports 410,000 jobs in the Big Apple. The $40 Billion in direct tourism spending has a $60 Billion economic impact for the city.
Sustainable Travel Statistics
(Source Booking.com 2019)
- 55% of Global Travelers Will Make Sustainable Travel Choices.
- 73% intend to stay at least once in an eco-friendly (green) accommodation.
- 70% will be more likely to book accommodation knowing it is eco-friendly.
While these sustainability statistics are very positive, the fact is that travelers have a hard time determining truly sustainable accommodations. As such, the actual people staying in sustainable lodging is much less than those willing to support the environment.
Conclusion
In summary, here is what we can say about travel and tourism in 2026:
- While travel has recovered nicely for U.S. travelers since the COVID-19 pandemic in 2020-21, International arrivals into the United States has not reached the peak visitors total from 2019 and is lower in 2025, than in 2024.
- Despite the impact of worldwide inflation and increases in travel costs, travelers are willing to spend more on travel in 2026.
- Reasons for traveling differ greatly by age group. Travel operators need to understand these differences when marketing to their prospective customers.
- Using travel statistics to identify rankings by country or city can be misleading if you don’t understand the statistical definition.
0 Comments